> For the complete documentation index, see [llms.txt](https://support.portsip.com/llms.txt). Markdown versions of documentation pages are available by appending `.md` to page URLs; this page is available as [Markdown](https://support.portsip.com/portsip-communications-solution/portsip-pbx-administration-guide/21-call-reports/call-reports-legacy.md).
# Call Reports(Legacy)
### Create and Run a Report
To create a new report:
1. Navigate to **Call Statistics > Call Reports**.
2. Click **Add**.
3. Configure the report using the available parameters.
4. Click **OK** to generate the report.
***
### Report Configuration Parameters
#### Report Type
* **Type**: Select the report template that will serve as the basis for the report.
#### Date Range
* **Range**: Select a predefined range or define a custom date range.
* Supported ranges include: Today, Yesterday, Last Week, Last 7 Days, Last Month, Last 30 Days, and Custom Range.
#### Scheduling
* **Frequency**: Choose how often the report runs:
* One Time Now
* Daily
* First Day of the Week
* First Day of the Month
#### General Settings
* **Name**: Assign a descriptive name to the report.
* **Mail To**: Specify an email address to receive the report download link.
* Note: The SMTP server must be configured correctly.
* **Export As**: Select the report format.
* Supported formats: CSV, HTML
> These parameters are available for all report types.
***
### Report Filters
Filters allow you to refine the data displayed in a report.
* Each report type supports its own set of filters.
* Filters apply only to the specific report being generated.
For example, to view only answered calls, apply a filter based on **Call Status = Answered**.
After configuring the filters, click **OK** to generate the report.
> ⚠️ If the selected date range contains a large number of calls, report generation may take longer.\
> A single **Normal Call Report** is limited to **20,000 calls**. Other report types do not have this limitation.
***
### Report Status and Saved Reports
While a report is being generated, its status is displayed as **Running**.
Once completed:
1. Click **Refresh**.
2. Locate the report in the list.
3. Click the **link icon** to download it.
***
### Normal Call Report
This report provides basic call-level details and supports the following filters:
**From**
Filter by caller number:
* Extension / Extension Range (e.g., `101` or `101-110`)
* Number (e.g., `003321456783`)
* Numbers Start With (prefix match, e.g., `035`)
* Numbers Contain (substring match, e.g., `327`)
* Internal Extensions
* External Numbers
**To**
Filter by callee number (same options as **From**).
**Call Status**
* Answered
* Not Answered
**Duration**
* Talking Time
* Ring Time
**Additional Fields**
* **Cost** – Call cost
* **CLI** – Outbound caller ID
* **DID / DDI** – DID/DDI number for inbound trunk calls
* **End Reason** – Who ended the call (caller or callee)
* **Trunk Name** – Trunk used for the call
* **User Data** – Custom data passed via REST API
***
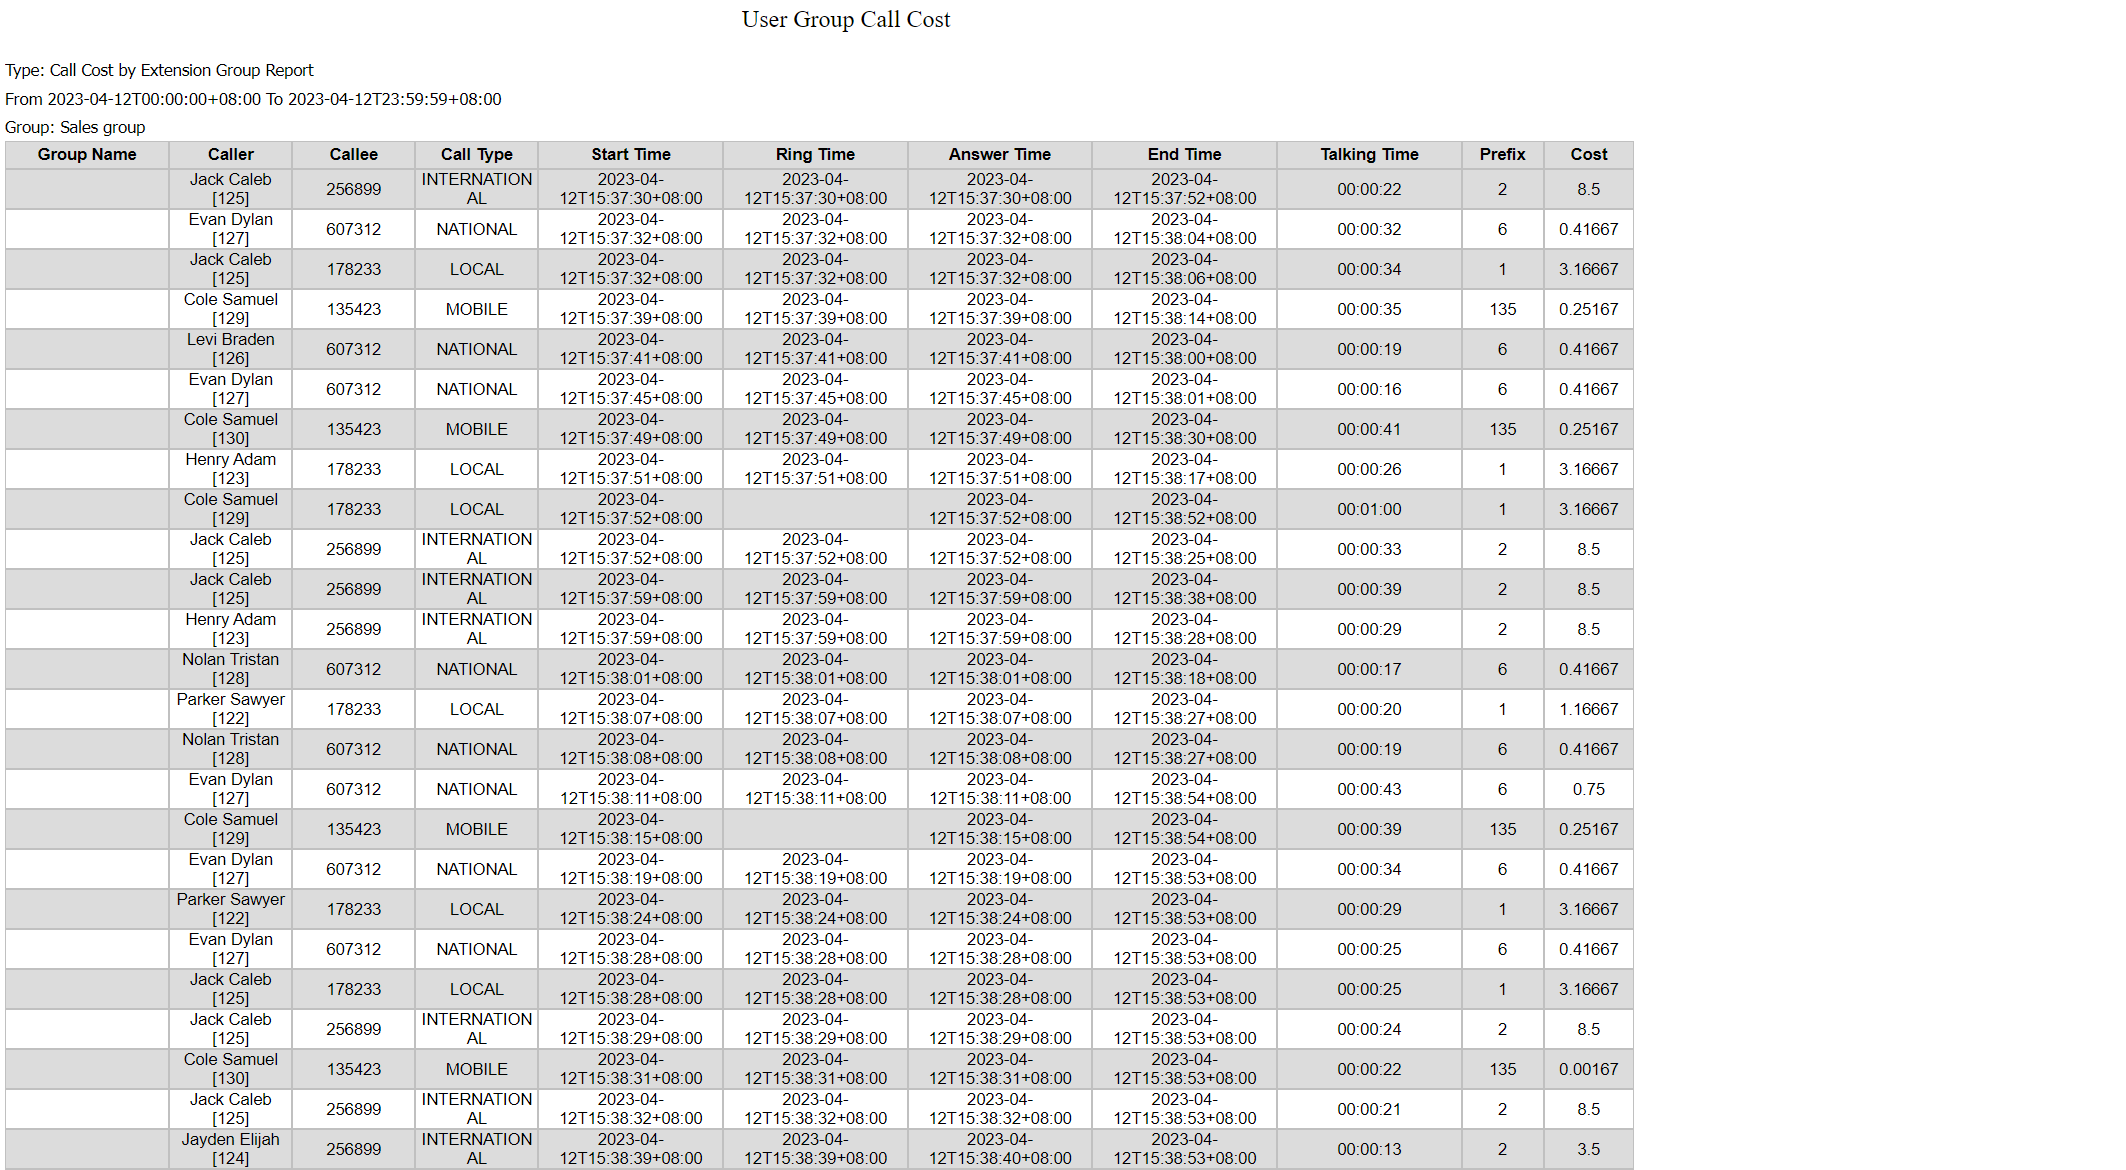
### Extension Group Call Cost Report
This report calculates call costs for a specified user group.
#### Filters
* **Type**:
* Any
* Local
* National
* Mobile
* International
* **Group Name** – User group associated with the call
* **Call Type** – Billing type matched by the billing rule
* **Prefix** – Billing rule prefix
***
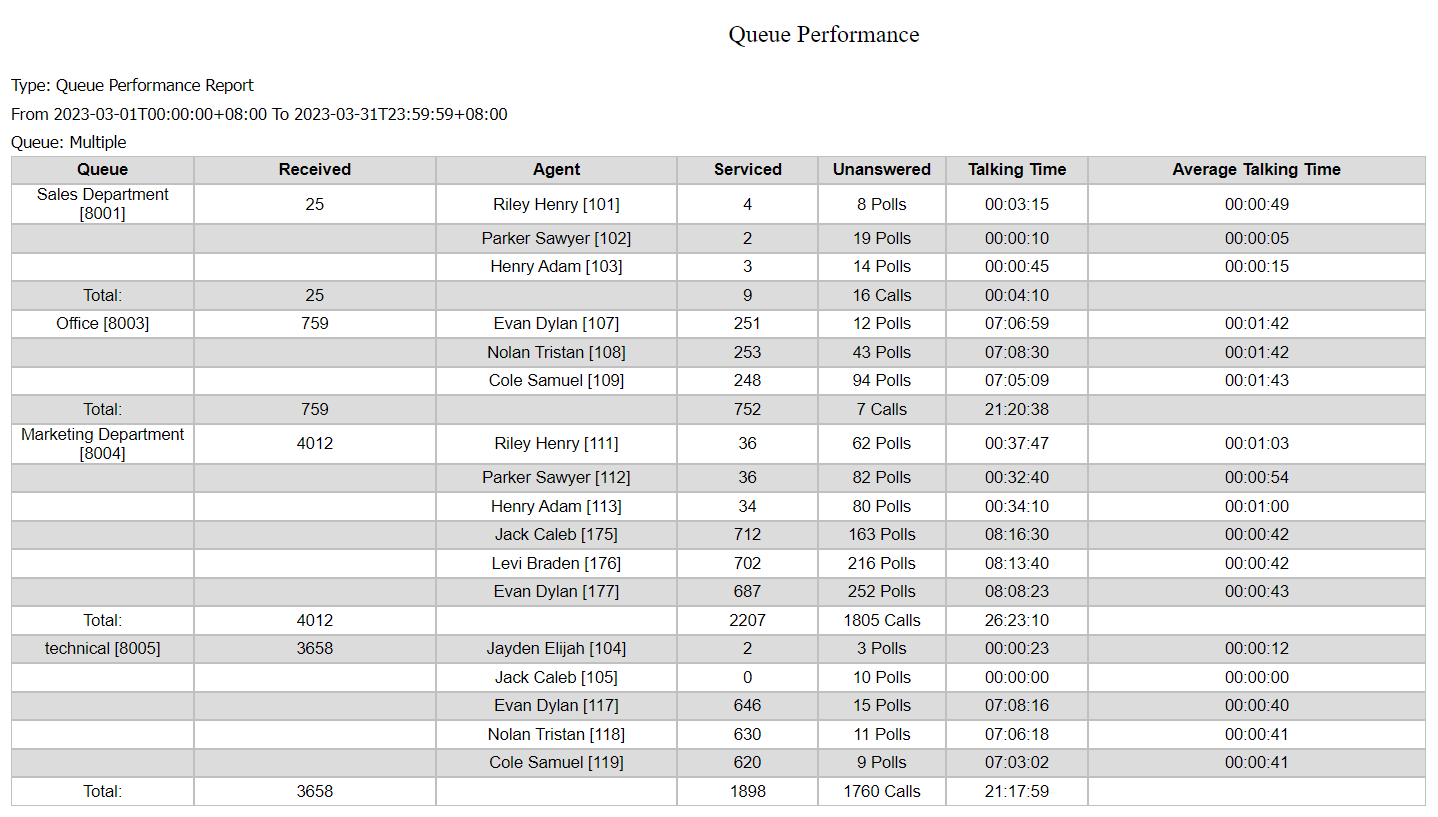
### Queue Performance Report
This report summarizes service levels for one or more queues, including:
* Total calls received
* Calls handled
* Calls not handled
Statistics are also broken down by agent, making it easy to identify high and low performers.
#### Filters
* Exclude Calls Dropped Before (Seconds)
* Call Queue – Select one or more queues
#### Metrics
* Queue
* Received
* Serviced
* Unanswered
***
### Queue Detailed Statistics
Provides comprehensive queue metrics, including
* **Calls**: Answered, abandoned, total, % serviced
* **Ring Time**: Total and average
* **Talk Time**: Total and average
***
### Queue Abandoned Calls Report
Helps identify potential causes of abandoned calls by showing:
* Waiting time
* Caller information
* Assigned agent
* Number of polling attempts
***
### Queue SLA Statistics
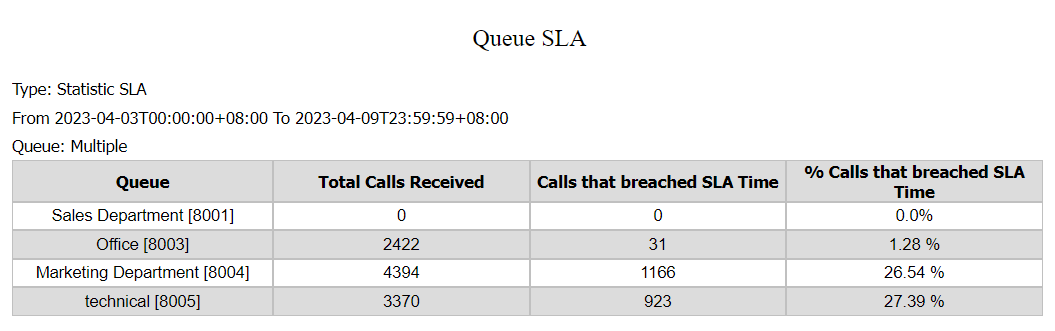
Displays:
* Total calls received per queue
* Number and percentage of calls missed based on SLA thresholds
***
### Queue Breaches SLA Report
Shows calls that exceeded the configured SLA, including:
* Call time
* Caller ID
* Waiting duration
You can exclude calls dropped before a specified time threshold.
***
### Queue Callbacks Report
Displays:
* Number of calls received
* Callback requests
* Successful and unsuccessful callbacks
***
### Team Queue General Statistics
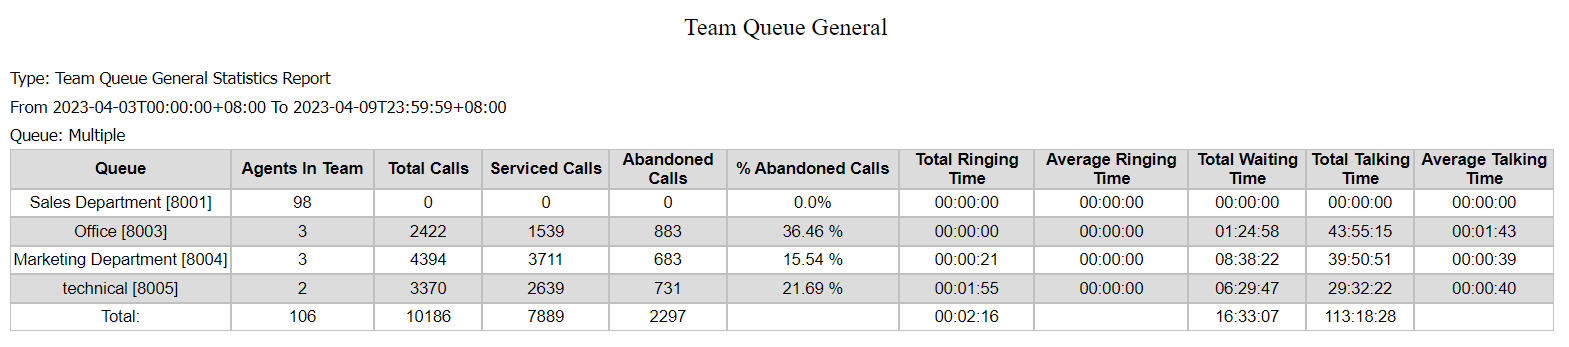
Focuses on **queue performance at the team level**, including:
* Call handling behavior
* Number of agents assigned to each queue
***
### Ring Group Statistics Report
Displays call statistics for one or more ring groups, including:
* Calls received
* Calls answered
Statistics are broken down by agent extension, helping identify performance trends and improvement areas.